[stock-market-ticker symbols="AAPL;MSFT;GOOG;HPQ;^SPX;^DJI;LSE:BAG" stockExchange="NYSENasdaq" width="100%" palette="financial-light"]
Author

admin

Browsing

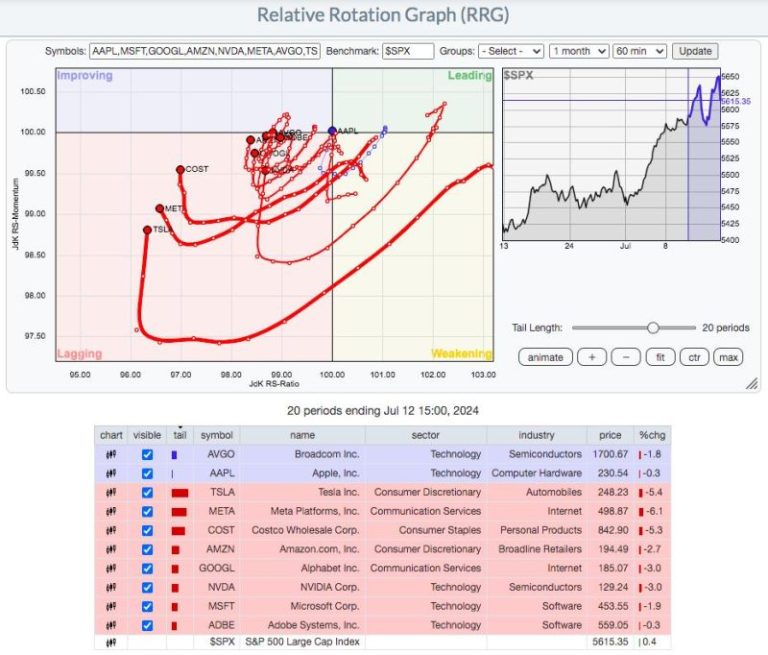
It was a very interesting week indeed. All-time high records continued to fall on a daily basis, but the complexion of the market most definitely changed during the latter part of the week. First, I want to pull up an hourly RRG chart to track 10 key growth stocks, most of which have carried the overall S&P 500 higher throughout 2024:

This chart is tracking the relative rotation of these 10 growth stocks (vs. the benchmark S&P 500) over the last 20 periods, or roughly 3 days. Many of these stocks started their 3-day journey on the right side of this chart, which highlights tremendous relative strength at that time. But look where they finished on Friday. Not one of these 10 stocks finished in the leading quadrant. Not one. AAPL held up best, but TSLA, META, and COST tumbled to close out the week. That type of behavior among these growth juggernauts would likely send you to the conclusion that we had 3 really bad days in the market. Instead, look at how the S&P 500 performed over the past 3 days from this hourly chart:

So what happened? How did the S&P 500 hold up when its most-heavily-weighted stocks fell so quickly?

Rotation. Bullish rotation. This is what sustains bull markets. Even the biggest and best leaders fall from time to time. But does the money leave the stock market or does it simply rotate and drive prices higher elsewhere. Well, last week it was the latter. Let’s check out large-cap growth (IWF) and large-cap value (IWD) and then the 11 sectors on that same 20-period RRG chart:

IWF:IWD

Sectors

In this case, two pictures say two thousand words.

Could the relative performance of the IWF and IWD have shown more disparity over the past few days than they did? Growth was tossed out the window, while traders suddenly fell in love with value stocks. I believe the June CPI report was the primary trigger for this rotation. I viewed it as a “sell on news” for growth stocks after months of “buying on rumor”. I also view it as “warning shots fired” towards Fed Chief Powell and his band of hawks. This report was an absolute DAGGER for those Fed officials that believe we should remain on the current “higher rates for longer” bandwagon. Check out the latest chart on core inflation at the consumer level:

The 1-month and 12-month rate of change (ROC) have rapidly declined. I swear I think the Fed is looking at a different chart, or maybe someone needs to turn their computers right side up. They’ve made it clear that they want sustainability towards their 2% target level. It sure seems to me that monthly Core CPI is back in the normal range and has been moving sustainably towards 2% for at least the last year. Yet the Fed keeps waiting, even talking about the possibility of another hike. Personally, I’m sick of this Fed. As I said, warning shots have been fired over the past few weeks. The bond market is SCREAMING at the Fed to lower rates. And growth stocks have just had their second bout of significant selling. We’re teetering folks.

I’ve been steadfastly bullish throughout this secular bull market, suggesting to everyone to avoid all the noise about crashes and collapses. I am, however, growing worried about the Fed’s handling of monetary policy. There are already economic signals that are telling me the cracks in our economic foundation are growing and spreading and that hopes of a “soft landing” are dwindling. If this isn’t stopped SOON, it’ll be too late, and we could be staring at a SIGNIFICANT market meltdown in the weeks and months ahead.

On Saturday, July 27th at 10:00am ET, I will be hosting an extremely important event, “The Fed and The Presidential Election Cycle: Why the S&P 500 May Tumble”. This event is FREE, but you must register and capacity is limited. If you want to consider ways to protect your capital, then I am urging you to sign up EARLY. For more information and to register, CLICK HERE.

Happy trading!

Tom

Editor’s note: This is part of NBC News’ Checkbook Chronicles, a series of profiles highlighting the financial realities of everyday Americans.

Doug Sharp isn’t a rich man — but he has played one in Hollywood.

Sharp, 59, lives in Los Angeles and until recently got the bulk of his income by driving for Uber and Lyft while moonlighting as a paid extra.

It’s the chance to earn the spotlight and work with others who share his passion for acting that keeps him going after years of having failed to find any other kind of full-time work.

Primary source of income: Sharp says he struggles to make ends meet, having survived the past few years on a generous pandemic unemployment reimbursement.

He has begun taking delivery orders on UberEats, but he said the pay barely makes it worth it.

What keeps Sharp going is acting — a notoriously fickle endeavor but one he says has upside potential. He recently got a small speaking part in a coming production featuring at least two Hollywood A-listers — and saw his daily pay rate go from about $200 to nearly $1,200.

‘The money for background is good, and there’s always the possibility of being upgraded to principal,’ he said. ‘That has happened to me — I have not found a replacement for it.’

Still, it’s not consistent enough for him to obtain full Screen Actors Guild benefits, so his health insurance is through Medicaid.

Living situation: Sharp lives alone and said his housing situation is unstable. It includes periodically renting from a friend, as well as an unauthorized arrangement he wasn’t comfortable discussing on the record.

Economic outlook: After nearly a decade of making steady pay driving for Uber and Lyft, Sharp has effectively quit both platforms for now, in part, he said, because their base pay and regular rates are no longer enough make it worth it to use them, especially for what’s needed to live in Los Angeles.

Acting remains enjoyable — Sharp said he isn’t a celebrity hound and simply enjoys being around other people.

‘The older you get, the less parts there are,’ he said. ‘However, the pool of older guys is smaller — and shockingly I always play the rich white guy, because that’s what I look like. But I didn’t I know look like a rich white guy until I started playing one.’

Yet the gigs have hardly been steady enough to make a career out of.

‘What I can tell you is I barely work,’ Sharp said. ‘In May I worked two days, in April I worked four days, in March I worked two days, in February I worked two days, in January I worked one day.’

Budget pain points: Sharp struggles buying basic necessities, to the point that he found himself recently trying to return goods around his residence to Home Depot and Walmart for cash or credit.

He owns a car, a Fiat 500, but is trying to obtain a new one through a rental company so he can get back to driving for Uber and Lyft — even at the reduced rates. However, he’s not sure his credit score will be good enough for him to obtain the new vehicle.

Outlook: Sharp said he basically started his life over in his 40s, when he got a business degree from the University of Massachusetts-Amherst. But he graduated in 2013, when the economy was still emerging from the global financial crisis, and he couldn’t land a job.

Uber, and later Lyft, provided a lifeline, and he enjoyed the work. But over the years, their rates got lower and lower.

Still, returning to those platforms remains his key financial objective.

In the meantime, Sharp struggles with depression and anxiety.

‘The one thing people hate are educated white men who look rich but who are poor,’ Sharp said. ‘They think, ‘Oh, he must be lazy or on drugs. What is his problem?’ I get this — I’ve watched my friend group move away.’

‘I am ashamed about where I am in my life as it relates to my finances and not knowing how to fix it,” he continued.

Finding a full-time job — even at a fast-food restaurant, and even in a labor market that the Federal Reserve says remains relatively healthy — has been a lot more difficult than one might imagine.

‘I do qualify for food stamps; I do qualify for [Medicaid],’ he said. ‘I’m not embarrassed about that, but when I’m willing to work — and bust my ass — why is it that I can’t get a living wage?’

Ironically, fast-food jobs are now quite difficult to obtain, Sharp said, not least because their hourly wages are higher than in many other industries thanks to California’s new $20 minimum wage for workers in the sector.

‘It’s embarrassing, because it seems like there’s a piece of the puzzle that I’m not telling,’ Sharp said. ‘I’m doing everything I can.’

This post appeared first on NBC NEWS

The U.S. Federal Reserve may start cutting interest rates before year’s end. That could make future trips abroad more expensive for the nation’s travelers.

That’s due to how interest-rate policy affects the strength of the U.S. dollar.

Here’s the basic idea: An environment of rising U.S. interest rates relative to those in other nations is generally “dollar positive,” said Jonathan Petersen, senior markets economist and foreign exchange specialist at Capital Economics.

In other words, rising rates underpin a stronger U.S. dollar versus foreign currencies. Americans can buy more stuff with their money overseas.

The opposite dynamic — falling interest rates — tends to be “dollar negative,” Petersen said. A weaker dollar means Americans can buy less abroad.

Fed officials in June signaled they expect to cut rates once in 2024 and four additional times in 2025.

“Our expectation for now is the dollar will come under more pressure next year,” Petersen said.

However, that’s not necessarily a foregone conclusion. Some financial experts think the dollar’s strength may have staying power.

“There have been quite a few headlines calling for the U.S. dollar’s demise,” Richard Madigan, chief investment officer at J.P. Morgan Private Bank, wrote in a recent note. “I continue to believe the dollar remains the one-eyed man in the land of the blind.”

The Fed started raising interest rates aggressively in March 2022 to tame high pandemic-era inflation. By July 2023, the central bank had raised rates to their highest level in 23 years.

The dollar’s strength surged against that backdrop.

The Nominal Broad U.S. Dollar Index is higher than at any pre-pandemic point dating to at least 2006, when the central bank started tracking such data. The index gauges the dollar’s appreciation relative to currencies of the nation’s main trading partners such as the euro, the Canadian dollar and the Japanese yen.

For example, in July 2022, the U.S. dollar reached parity with the euro for the first time in 20 years, meaning they had a 1:1 exchange rate. (The euro has since rebounded a bit.)

In early July, the U.S. dollar hit its strongest level against the yen in 38 years.

A strong U.S. dollar gives “a discount on everything you’re purchasing while you’re abroad,” Petersen said.

“In a sense, it’s never been cheaper to go to Japan,” he added.

A record number of Americans visited Japan in April, according to the Asian nation’s tourism board. Benjamin Atwater, a communications specialist at InsideAsia Tours, a travel agency, attributes that partly to the financial incentive bestowed by a strong dollar.

In fact, he personally recently extended a work trip to Japan by a week and a half — instead of opting to travel elsewhere in Asia — largely because of the favorable exchange rate.

Everything from meals, hotels, souvenirs and the rental car were a “great value,” said Atwater, who lives in Denver and has long wanted to travel to Japan.

“It was always portrayed as one of the most expensive places you can go, [but] I was getting some of best steaks I’ve ever had for like $12,” he said.

In reality, the dynamics driving dollar fluctuations are more complex than whether the Fed raises or lowers interest rates.

The differential in U.S. rates versus other nations is what’s significant, economists said. Fed policy doesn’t exist in a vacuum: Other central banks are also simultaneously making interest-rate choices.

The European Central Bank cut interest rates in June, for example. Meanwhile, the Fed has kept rates higher for longer than many forecasters anticipated — meaning the rate differential between the U.S. and Europe has widened, helping support the dollar.

“The Fed’s on hold, other central banks are getting ready to ease and the Bank of Japan (BoJ) seems stuck in a moment,” J.P. Morgan’s Madigan wrote.

“If Japan wants the yen to stabilize, policy rates need to move higher,” he added. “That doesn’t appear to be happening anytime soon. With the ECB expected to cut ahead of the Fed, I expect current euro weakness to also prevail.”

This is happening against the backdrop of a relatively strong U.S. economy, which also generally supports a strong dollar, Petersen said. At a high level, a strong economy means there will generally be higher economic growth and/or inflation, which means a greater likelihood the Fed will keep interest rates relatively high, he said.

A strong economy also typically incentivizes foreigners to park more money in the U.S., he said.

For example, investors generally get a better return on cash when interest rates are high. If an investor in Europe or Asia were getting perhaps 1% or 2% on bank account holdings while such holdings in the U.S. were yielding 5%, that investor might shift some money to the U.S., Petersen said.

Or, an investor might want more to hold more of their portfolio in U.S. rather than European stocks if the economic growth outlook wasn’t good in Europe, he said.

In such cases, foreigners buy dollar-denominated financial assets. They’d sell their local currency and buy the dollar, a process that ultimately bids up the dollar’s strength, Petersen said.

Exchange rates “all come down to capital flows,” he said.

While these dynamics also hold true in emerging markets, currency fluctuations can be more volatile than in developed nations due to factors like political shocks and risks to commodity prices like those of oil, he added.

This post appeared first on NBC NEWS

Earnings are coming into focus and today Erin looks at the big earnings stocks to find out which look the best going into earnings. She took the list of stocks and sorted them by the Price Momentum Oscillator (PMO) which put the strongest stocks at the top of the list. Find out which stocks are set up best going into earnings!

Carl talks about finding high dividend payers using the list of stocks in dividend paying ETFs. Find the aristocrats using the Symbol Summary on StockCharts to find the links to the ETF websites for more information. Some ETFs to consider: TBG, NOBL and KNGS.

Carl opens with the market reaction to the Trump assassination attempt. He also gives us his market outlook that covers Bitcoin, Gold, the Dollar, Gold Miners, Crude Oil, Yields and more! Finally he covers the movement of the Magnificent Seven.

Erin shares her thoughts on current sector rotation with a review of the sector CandleGlance followed by her earnings discussion and symbol requests.

01:24 Market Overview

16:16 Dividend Aristocrat Discussion

22:41 Questions (UNG, AMZN)

28:48 Sector Rotation

33:09 DP Signal Tables

34:36 Earnings PMO Sort

42:18 Symbol Requests

JOIN US LIVE! Register on the DecisionPoint.com homepage!

Watch the latest episode of the DecisionPointTrading Room on DP’s YouTube channel here!

Try us out for two weeks with a trial subscription!

Use coupon code: DPTRIAL2 at checkout!

Technical Analysis is a windsock, not a crystal ball. –Carl Swenlin

(c) Copyright 2024 DecisionPoint.com

Disclaimer: This blog is for educational purposes only and should not be construed as financial advice. The ideas and strategies should never be used without first assessing your own personal and financial situation, or without consulting a financial professional. Any opinions expressed herein are solely those of the author, and do not in any way represent the views or opinions of any other person or entity.

DecisionPoint is not a registered investment advisor. Investment and trading decisions are solely your responsibility. DecisionPoint newsletters, blogs or website materials should NOT be interpreted as a recommendation or solicitation to buy or sell any security or to take any specific action.

Helpful DecisionPoint Links:

Trend Models

Price Momentum Oscillator (PMO)

On Balance Volume

Swenlin Trading Oscillators (STO-B and STO-V)

ITBM and ITVM

SCTR Ranking

Bear Market Rules

For more than 10,000 Olympic athletes, making it to Paris this summer is a dream come true. Thousands of potential tourists feel otherwise.

Delta Air Lines says travelers are avoiding the city this summer and booking to destinations elsewhere, amounting to a $100 million hit for the airline during an otherwise bustling summer for European travel, CEO Ed Bastian said.

Delta’s third-quarter profit and revenue forecast fell short of Wall Street expectations after airlines flooded the market with added flights. The airline reiterated its full-year outlook Thursday.

“Unless you’re going to the Olympics, people aren’t going to Paris…very few are,” Bastian told CNBC. “Business travel, you know, other type of tourism is potentially going elsewhere.”

Delta has the most service of any U.S. airline to Paris and has a joint venture with Air France. Together the two carriers have approximately 70% market share in nonstop service between the U.S. and France, according to consulting firm ICF.

On July 1, Air France-KLM, the parent of Air France, forecast a revenue hit of as much as 180 million euros $195.5 million) in June through August because of the Olympic Games.

“International markets show a significant avoidance of Paris,” the company said. “Travel between the city and other destinations is also below the usual June-August average as residents in France seem to be postponing their holidays until after the Olympic Games or considering alternative travel plans.”

Bastian said Paris demand after the Olympics, which run July 26 through August 11, will likely be strong. “During the period itself there’s a little bit of a hesitation,” he said. Air France-KLM had a similar projection.

One clear deterrent for mid-summer travel to Paris: Prices for hotel rooms are set to skyrocket.

Hotel-data firm STR said revenue per available room for upscale hotels in Paris will soar as much as 45% in July and August from last year. Meanwhile, it forecast a 3% to 5% increase in the metric in London and 2% to 4% increase in Rome for the same months over 2023.

Many travelers were already shifting their European vacations beyond the traditional summer travel season, Delta’s president, Glen Hauenstein, said on an earnings call on Thursday. That gives airlines a chance to earn more revenue outside of traditional peak seasons.

“We see the season extending as a whole group of people, whether or not it’s retirees, whether or not it’s people with double incomes and without children, who don’t have the school concerns,” he said. “It’s actually a better time to go to Europe in September and October than it is potentially in July and August when the weather is so hot and everything is so packed.”

He also said Delta is seeing a boom in travel to Japan, thanks in large part to a favorable exchange rate for U.S. tourists.

“When the yen was 83 [per U.S. dollar], it was very difficult to be able to afford to go see Japan and all the great things that Japan has to offer. With the yen at 160, it’s a very different world for U.S. travelers and they seem to be taking great advantage of that,” he said.

Disclosure: CNBC parent NBCUniversal owns NBC Sports and NBC Olympics. NBC Olympics is the U.S. broadcast rights holder to all Summer and Winter Games through 2032.

This post appeared first on NBC NEWS

Carvana (CVNA) stock has recently appeared in the StockChartsTechnical Rank (SCTR) Top 10 list, which makes it a stock worth analyzing. If you look at Carvana’s stock chart (discussed in detail below), you’ll see that besides hitting new 52-week highs, it has shown some interesting price movement in the last year. The stock price gapped up on the last two earnings reports, leading to stock upgrades from analysts.

Going back to early 2023, you’ll notice that Carvana’s SCTR score crossed above the 70 level in May 2023 (see upper panel). Even though the SCTR score crossed above 80 and 90, albeit briefly, it fell below the 70 level relatively fast.

Another attempt to cross above the 70 level was made, but that was very choppy. At the end of May 2023, Carvana’s SCTR score crossed above 90 and stayed there until January 9, 2024. Since February 2024, the SCTR score has sustained its position above 90. Will Carvana stock see a follow-through to the upside?

A Deep Dive Into Carvana Stock

The daily stock chart of Carvana below shows the stock is trading above its 21-day exponential moving average (EMA), and a pattern of higher highs and higher lows is in play. The relative strength index (RSI) is just above 70, which means there’s potential for further upside in Carvana’s stock price.

CHART 1. DAILY CHART OF CARVANA STOCK. The stock is moving higher, trading above its 21-day EMA, and its RSI has just crossed into overbought territory. Chart source: StockCharts.com. For educational purposes.

The weekly chart of CVNA (see below) looks even more promising. The overall trend this year is up, and the RSI has crossed the 70 level. What’s interesting is that if you look at the RSI in the past couple of times it’s been above 70, you’ll notice that, each time it subsequently dipped below 70, it was a “buy the dip” opportunity.

CHART 2. WEEKLY CHART OF CARVANA’S STOCK PRICE. Carvana has plenty of upside room before it reaches its all-time high. With this year’s uptrend and an RSI that helps identify price dips, there is the likelihood of buying on a dip.Chart source: StockCharts.com. For educational purposes.

The RSI remained above 50, and the upward-sloping trendline remained intact. Both are indications the uptrend in Carvana’s stock price is solid. What’s even more positive on the weekly chart is that there’s a lot of room for upside movement. Carvana’s all-time high is over $350. 

Carvana’s stock price today is around $142. The stock has caught Wall Street’s attention ahead of earnings. Carvana reports Q2 earnings on July 31 after the close. Carvana stock has been in the news lately; it’s made strides in electric vehicle sales, allowing buyers to get tax credits at the point of sale. Analysts are also making buy recommendations for Carvana. Carvana’s stock price has a lot going for it, and the technicals look great. 

The bottom line: Add Carvana’s stock chart to your ChartList and look to take advantage of a dip in the stock’s price. According to a Barron’s report, Carvana’s stock price is volatile, mainly due to short selling, so dips are highly likely.

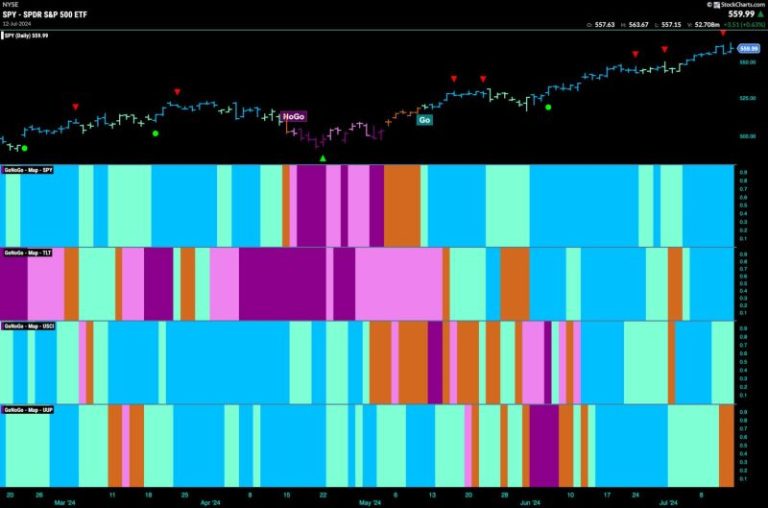
Good morning and welcome to this week’s Flight Path. It was another strong week for U.S. equities as we saw S&P hit new highs on a week of strong blue “Go” bars. Treasury bond prices had a good weeks as well with a string of blue “Go” bars and the U.S. commodity index was able to remain in a “Go” trend although we did see some weakness with aqua bars as the week came to a close. The dollar was the only asset this week that fell out of its “Go” trend. We saw some uncertainty as price dropped and GoNoGo Trend painted a couple of amber “Go Fish” bars.

$SPY Paints Countertrend Correction Icon at New Highs

Equity prices continued higher this week and GoNoGo Trend painted uninterrupted strong blue “Go” bars. Late in the week we saw a Go Countertrend Correction Icon (red arrow) at the high indicating that price may struggle to go higher in the short term. When we look at the oscillator panel we can see that it fell out of overbought levels but has quickly returned showing sustained market enthusiasm. We will watch to see if momentum wanes this week and will look for price to consolidate at these new higher levels.

Strong “Go” trend. That is the reading from the weekly chart. Another higher weekly close on a strong blue “Go” bar is what we are seeing here. If we look at the oscillator panel we see that we are staying in overbought territory and so we do not see momentum falling off enough to trigger a countertrend correction icon (red arrow) on the price chart.

Treasury Rates in Strong “NoGo” Trend

This week confirmed the “NoGo” picture that had emerged.  GoNoGo Trend painted a whole week of strong purple “NoGo” bars and price made a new lower low. When we look to the oscillator panel we can see that GoNoGo Oscillator fell back through the zero line after a few bars in a GoNoGo Squeeze and is now in negative territory at a value of -2. This tells us that momentum is resurgent in the direction of the “NoGo” trend and so we see a NoGo Trend Continuation Icon (red circle) on the price chart.

Dollar Displays Uncertainty

Last week GoNoGo Trend informed us that the “Go” trend was weak after it fell away from its most recent high and painted a number of weaker aqua “Go” bars. This week we saw price fall further, gapping lower mid week. This led to GoNoGo Trend painting a couple of amber “Go Fish” bars telling us that not enough of the GoNoGo criteria are being met to determine a trend in either direction. If we look to the GoNoGo Oscillator for clues, we can see that it has failed at zero, and is dropping fast toward oversold territory. There is negative momentum here.

The weekly chart still tells us that we are hanging on to the longer term “Go” trend. After a destructive week, we are trading close to levels that could well suggest support. As GoNoGo Oscillator falls toward the zero line, we will watch to see if it finds support at that level. If it does, we will expect the “Go” trend to continue.

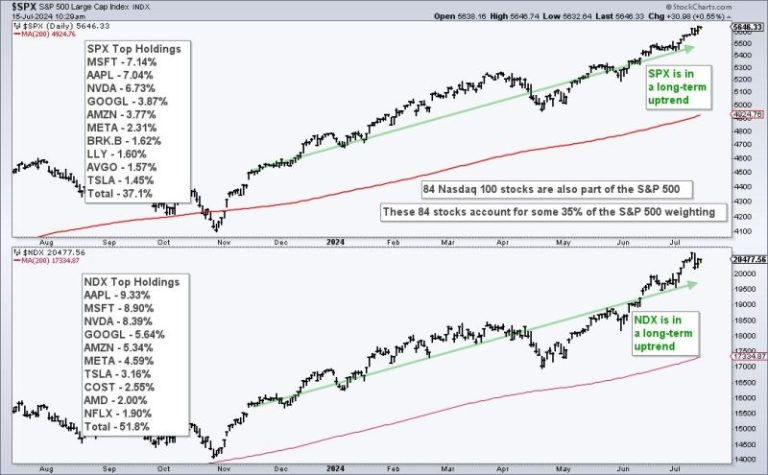
The Nasdaq 100 is a major driver in the stock market and Nasdaq 100 breadth indicators should be part of our broad market analysis routine. 84 Nasdaq 100 stocks (16.8%) are also in the S&P 500 and their weighting accounts for over 30% of the S&P 500. In fact, the six largest stocks in the S&P 500 come from Nasdaq 100 and account for 31.26%. The chart below shows the holdings for each index. Also note that both are in long-term uptrends.

Nasdaq 100 stocks also represent the risk appetite within the stock market. These stocks typically have higher growth rates and higher Betas. Chartists can track performance for Nasdaq 100 stocks using Nasdaq 100 specific breadth indicators. I want to trade Nasdaq 100 stocks and be fully invested when these indicators are bullish. I want to shun Nasdaq 100 stocks and raise cash when these indicators are bearish. We use a similar model for our Dual-Momentum Rotation Strategies at TrendInvestorPro. To this end, I am using three long-term breadth indicators to quantify Nasdaq 100 conditions. The chart below shows the percentage of Nasdaq 100 stocks above their 150 and 200 day SMAs as well as 52-week High-Low Percent. The latter is the percentage of 52-week highs less the percentage of 52-week lows.

All three indicators are long-term oriented and I am using bullish/bearish thresholds for signals. Divergences do not figure into my analysis because these are, more often than not, just distractions. Notice how QQQ advanced even as bearish divergences formed throughout 2024 (red arrow-lines). I will stick to the signals and ignore the nuance. NDX %Above 200-day SMA turns bullish with a move above 60% and stays bullish until a bearish signal triggers with is a cross below 40%. Adding signal thresholds above/below the midpoint (50%) reduces whipsaws. NDX %Above 150-day turns bullish with a move above 70% and bearish with a move below 30%. These thresholds are wider because the moving average is shorter. And finally, NDX High-Low Percent turns bullish with a move above +10% and bearish with a move below -10%.

Using all three indicators, chartists can take a weight of the evidence approach for assessing the Nasdaq 100. The bulls rule when two of the three indicators are on bull signals and the bears rule when two of the three are on bearish signals. A bearish signal triggered in January 2022 and a bullish signal triggered in early February 2023.

TrendInvestorPro recently introduced a market timing model based on long-term breadth indicators for the S&P 500 and Nasdaq 100. We published an extensive report and video describing this model and how it compares to models that use small-cap breadth. This model will be used for our Dual Momentum Rotation Strategy that trade Nasdaq 100 and S&P 500 stocks. Click here to subscribe and gain immediate access.

////////////////////////////////////////

DVD rental service Redbox is set to shut down after 22 years in business, as streaming continues to dominate the at-home entertainment market.

Redbox’s parent company, Chicken Soup for the Soul Entertainment, changed its Chapter 11 bankruptcy case, filed last month, to a Chapter 7 liquidation case on Wednesday. The conversion signifies that the company couldn’t come up with a repayment plan for its outstanding debts and will soon turn to selling off assets to pay back creditors.

With the change to a Chapter 7 case, all employees will now be laid off and Redbox’s 24,000 kiosks will close. Lawyers for Chicken Soup for the Soul told the court they had worked “day and night” to find a solution to avoid the outcome, Deadline reported.

A current Redbox employee, who asked not to be identified due to uncertainty over future legal actions he said some at the company are considering, said the news has been destabilizing.

“Sentiment’s in the gutter,” he said. “We have coworkers who’ve missed rent, facing eviction.”

The employee said staffers were told during a town hall meeting Thursday that they wouldn’t be receiving pay for the hours they’ve worked so far this month. Additionally, he said layoffs wouldn’t be made official until a bankruptcy trustee is appointed, raising concerns about when employees can file for unemployment insurance.

A Delaware judge overseeing the case indicated Wednesday that “there is no means to continue to pay employees,” the Hollywood Reporter reported Thursday.

A lawyer for Redbox and a representative for the company didn’t immediately respond to requests for comment.

Founded in 2002, Redbox at its peak shook up Hollywood with its rental service, which at the time was cheaper than buying a DVD. But with the rise of digital offerings and streaming platforms, DVD sales collapsed during the 2010s.

In 2022, Redbox had $325 million in debt, and Chicken Soup for the Soul Entertainment acquired it.

The parent company had accumulated $1 billion in debt by the time of its bankruptcy filing last month. According to court documents filed earlier this month, it was struggling to make payroll and pay for health care plans for its more than 1,000 employees.

Redbox is just the latest physical media company that has struggled to survive streaming’s dominance. Some 99% of U.S. households pay for at least one service, a Forbes survey found this year; others rely on free ad-supported streaming platforms. This year, Best Buy stopped selling physical media like DVDs and Blu-rays, attributing it to the shift in consumption of entertainment.

Streaming, meanwhile, reached a record-high share of TV viewership in May, a recent Nielsen report found.

This post appeared first on NBC NEWS

In this edition of StockCharts TV‘s The Final Bar, Dave recaps a strong Monday for value stocks, with the Financial and Energy sectors leading the S&P 500 and Nasdaq to new highs. He shares an update on the Hindenburg Omen, how Bitcoin has regained its 200-day moving average, and key levels to watch for XLE, FANG, APA, XLF, GS, KEY, and AMZN.

See Dave’s chart on new 52-week highs and lows here!

This video originally premiered on July 15, 2024. Watch on our dedicated Final Bar page on StockCharts TV!

New episodes of The Final Bar premiere every weekday afternoon. You can view all previously recorded episodes at this link.